Great analysis! Fantastic job.Originally Posted by ;
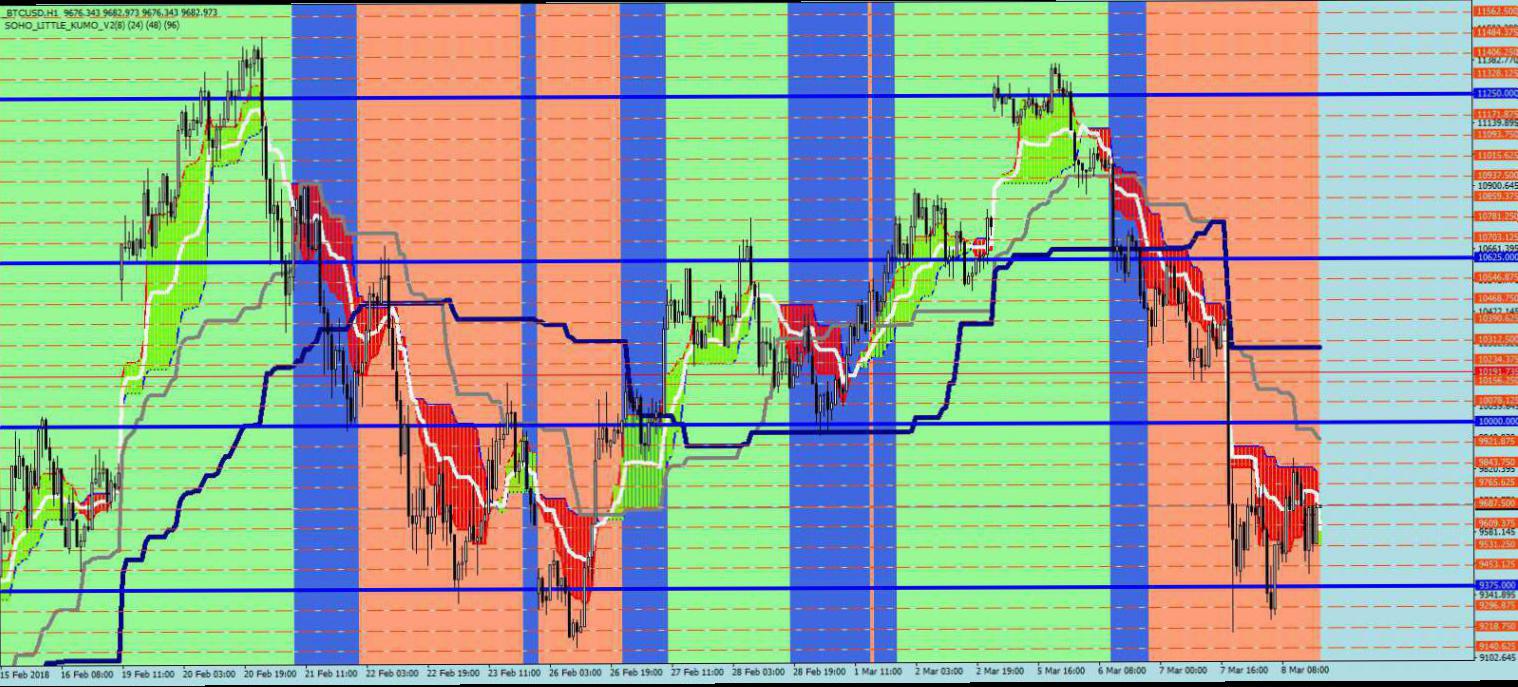
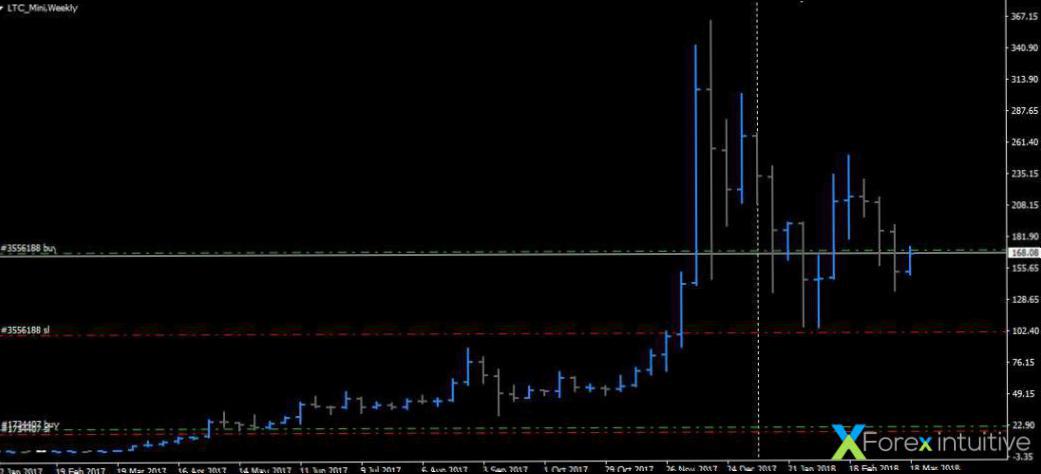
Bitcoin Technical Analysis This thread is devoted to technical analysis of the various Bitcoin and crypto-currency pairs. My very own egy is Elliott Wave analysis combined with Fibonacci relationships in price action as a way of understanding previous action and predicting price behavior. But, analysis amd talks in this thread are not limited to these methods. With the overall newness of crypto-currencies and the total amount of hype surrounding these - and Bitcoin specifically - this thread will serve both as a knowledge...


 Reply With Quote


