


This is a well known acronym spanning across many industries. It is human nature to try to over-complicate tasks to try gain the competitive edge.
Most traders initially believe that by making their systems increasingly complicated, they’re making positive steps to improve their trading in an attempt to ‘out smart’ the rest of the herd.
All this really achieves is: taking on more workload than necessary, making an analysis more difficult and confusing, and it turns the relatively straight-forward task of making a trading decision into a much more stressful and difficult process.
Today I wanted to share some tips on how you can keep your trading simple and effective.
If you ever feel like you’re losing grip of your trading, do yourself a favor and refer back to this article to give your Forex trading a clean-up.
DON’T GO CRAZY WITH SUPPORT & RESISTANCE LEVELS OR TREND LINES
This has got to be the quickest way to make a mess of your Forex charts and make interpreting your analysis a nightmare – yet there are a lot of traders still committing this sin.In our last lesson: 4 Support & Resistance Mistakes That Screw Your Charts Up, we talked about how marking more than a few lines is enough ‘tip the scales’, and make your chart look confusing.
If you’re really struggling with where to mark your levels, ask yourself this question: “If I was only allowed to mark one level on my chart, where would I set it to best highlight my analysis”.
Check out my EURUSD chart below…
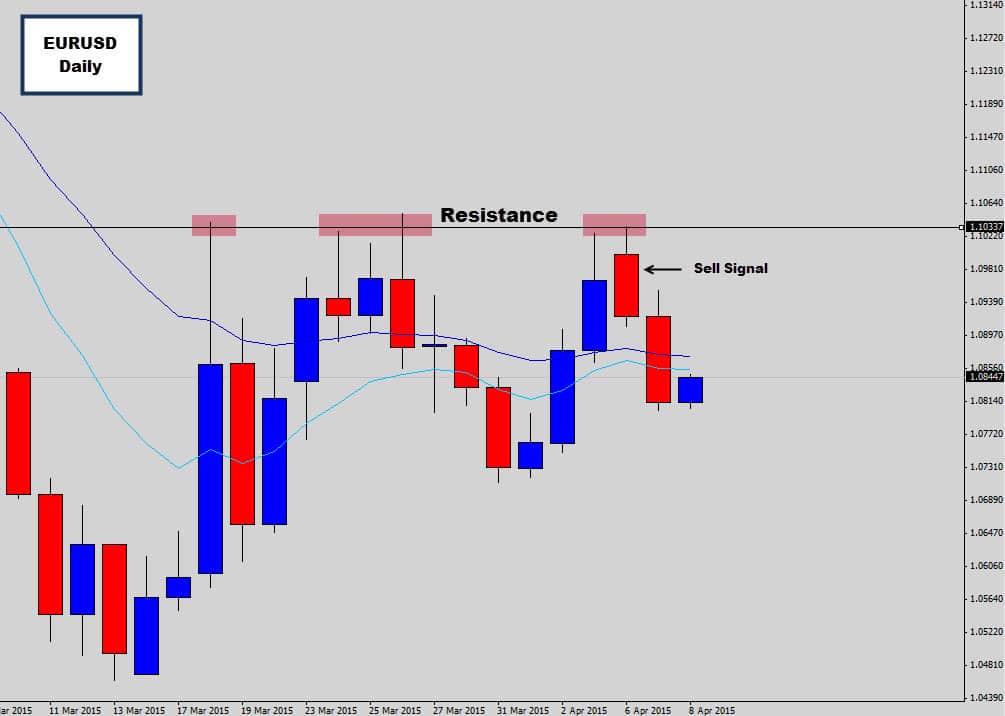
I am confident the above chart communicates my analysis clearly, even with just this one level. We could probably extend this a little by marking out the next support level here, but we wouldn’t need to go any further than that.
The ‘one level’ approach can be a very effective way of simplifying the way you mark support and resistance levels. You will often see my Forex charts with only one or two horizontal lines on them.
Always keep your analysis clear and concise for your own benefit. Other traders should be able to take one look at your charts, and understand exactly what you’re trying to communicate.
Ask a fellow trader to check out your charts and get their opinion. They may not be able to read your analysis because they simply don’t understand your system, or your chart just may look like a war zone of data which confuses them, which means it’s likely to confuse you too.
If you can’t remember what level is for what, and you’ve got colored spaghetti all over your chart – it might be time for a ‘detox’. Scrub that chart clean, start again and keep things simple!
SUMMARY
Don’t mess your chart up with masses of support, resistance or trend lines – you’re only going to make interpreting the charts harder for yourself. If you only were allowed to market one level on your chart, where would you place it? Keep to this rule to help de-clutter your screen.DEVELOP A DAILY TRADING ROUTINE
Are you a ‘fly by the seat of your pants’ kind of Forex trader?
Don’t just ‘wing it’ when it comes to checking charts – you will benefit from a structured routine.
Introduce the next level of discipline into your trading by taking advantage of the benefits a routine has to offer. A daily trading routine can:
- Help remove chaos, fragmentation and undisciplined trading behavior – and give you back a sense of control
- Prevent you from missing profitable trading opportunities
- Allow you to organize your real life and trading together so they work in harmony, instead of conflicting
- Help you maintain a healthy trading/life balance so you’re not glued to trading screens any more than necessary
We all know how addictive Forex trading can be, and how easily it is to over-commit yourself to the charts. Staring at price charts for long periods of time is not healthy and it can cause you to do really silly things.
One of the main benefits of a routine is to structure your trading around certain hours and prevent you from wasting time watching price ticking away meaninglessly.
In any good trading system – there are key times when you can check the market for trading opportunities. If your trading system requires you to sit in front of the chart endlessly, burn it and move on.
As a price action trader, the key times for me are
- The New York Close
- Around the London Open
Here in Australia – we’re kind of at a geographically strategic place for Forex trading. The New York close occurs in the morning, and the London open is in the late afternoon.
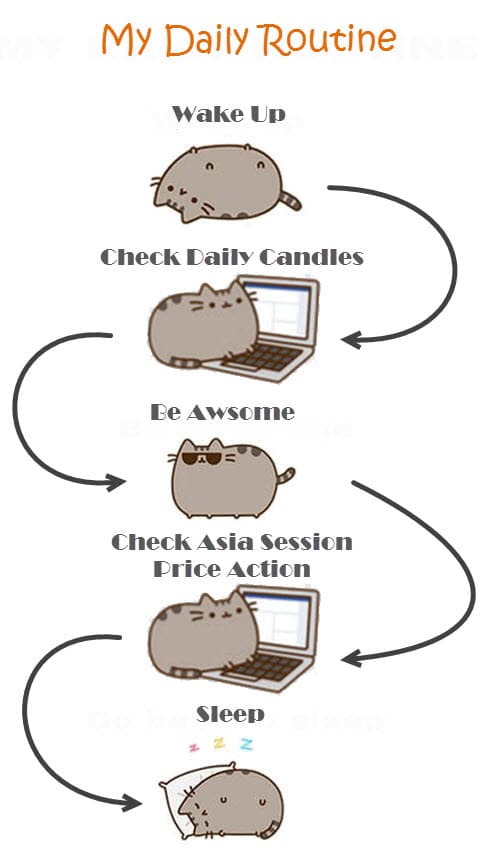
So, the first thing I do is get up, do my morning things and get ready to check the markets at the New York close for any end of day signals. Then I have all day to do any other tasks I set out for myself, until it is time for the London open in the afternoon.
At the London open – I re-scan the markets to observe what occurred during the Asia session. I am particularity on the look out for any Asia breakout traps which may present good trading opportunities as the market moves into the busier trading sessions of London and New York. I can set up any pending orders and let the market carry on with it’s thing, while I carry on with mine.
Below is an example of the Asia failed breakout in formation, and generally what I am looking out towards the end of the Asia session…
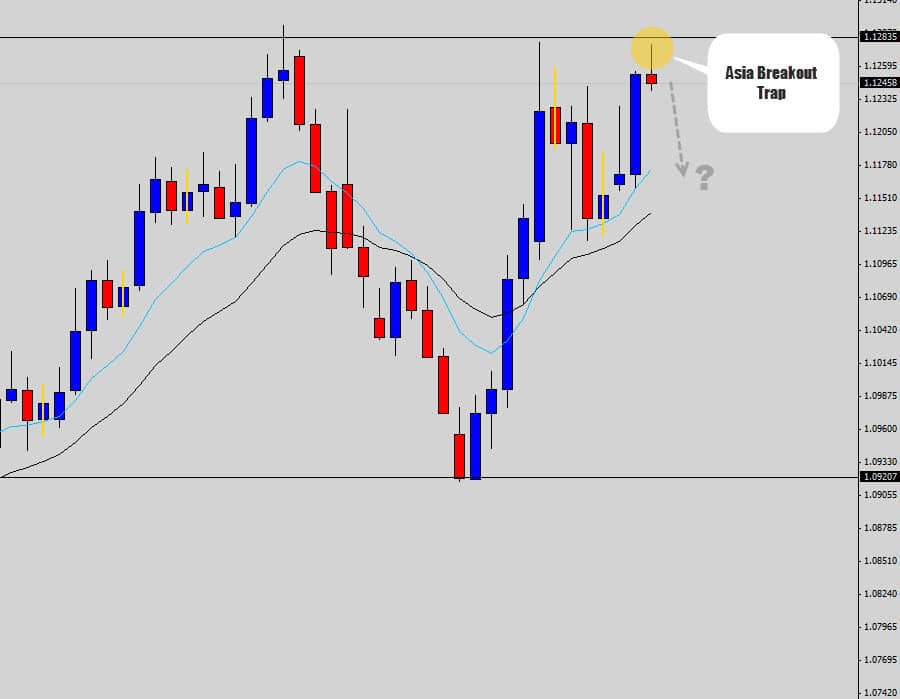
The screen shot above was taken just around London open. Because there was a failed breakout during Asia, I am anticipating the market will push down going into the London/Us session. Keeping it real simple!
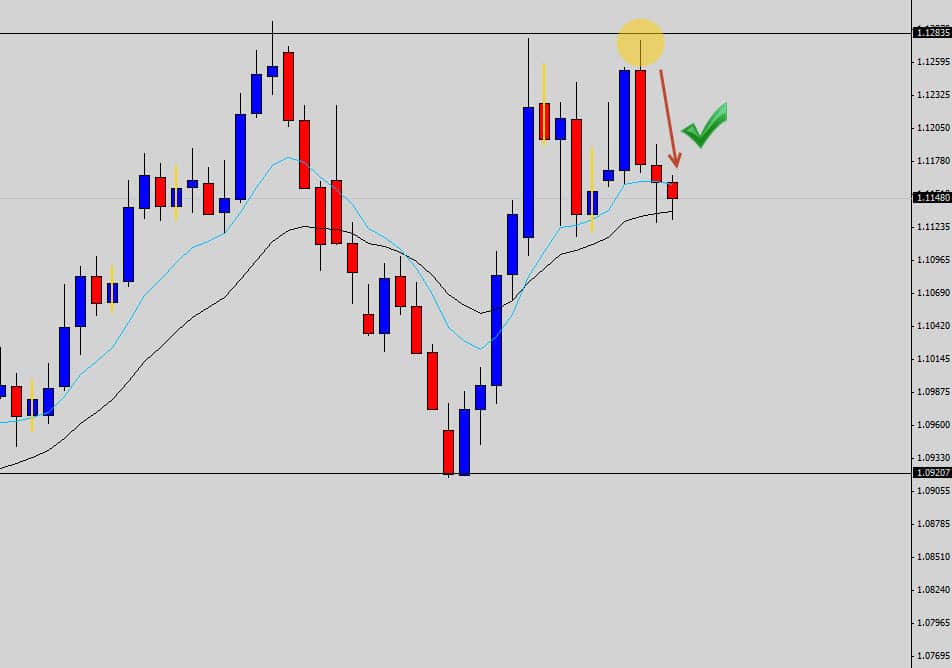
The market did just that, and this is a common strategy I use everyday in the markets and one you can learn more about in the War Room.
I don’t really have to be at the charts at any other time. Some War Room members like to trade the 4 hour charts, so they could set their alarms every 4 hours between a set period to check in with the market and scan for any 4 hour price action signals.
Traders will develop a strong urge to intervene with open positions if they are sitting there staring at them for prolonged periods of time. There is nothing more stressful than watching an open position while it is ticking into the negative. Some traders let their emotions get the better of them and ‘cut their losses’ by exiting early, only to find that price later reversed and hit the original profit target.
If you committed yourself to a structured routine, you would instead check back in with the markets at your designated time to see a trade that closed in profit – noticing that it dipped into the negative before hitting target but being unaffected emotionally because your trade was successful.
See the difference here? You could sit at the screen and allow the natural movements of the market churn your stomach, or just me back later and see how everything unfolded.
Don’t be one of those traders who ‘babysits’ their positions and becomes the ‘OCD micro-manager‘. Set your trades up, walk away, go back to your life and let your trades unfold in a natural way.
How do you determine when it is most important to check your charts? Develop a routine that will work for you and stick to it.
Your will be surprised what you can achieve – most ‘full-time’ traders still maintain a day-job, study full-time, or are full-time stay-at-home parents. Many War Room traders have developed a routine which allows them to trade effectively around their day-to-day obligations and you can too.
SUMMARY
There is no need to sit and stare at ticking candlesticks all day. Develop a routine around your daily life so you can allocate some time to check the market at key times. Two key times I recommend if possible in your time zone is to check the London open and the New York close.CUT BACK ON ALL THE ‘NON-ESSENTIALS’
As humans we are naturally innovative and are always looking to improve on what we build.
The counter-intuitive nature of the market conflicts with the way we are programmed to function in our day-to-day lives.
With Forex trading, simplicity can be the ultimate level of sophistication and provide much better results than a system which has been extended to use more data and variables.
It’s really important that you know your limits and you don’t make Forex trading so mentally taxing for yourself.
At first, adding lots of indicators onto your chart for ‘extra confirmation’ may seem like a really good idea, but most will agree it does short, and long term damage.
A minority of traders will say boosting up your chart with indicators is a good ‘filtering’ method for screening out bad trades.
In reality, all this achieves is an overload of information – and results that conflicts with one another! A typical situation you will run into when dealing with multiple indicators is:
- Indicator A says buy
- Indicator B tells you to sell
- Indicator C is saying you should stay out of the market.
A price chart shouldn’t be hard to read or interpret. But all the ‘extras’ will give you a sense of mental fog. The essential data lies in the price movement itself.
Candlesticks for example, give you 4 points of important data – the high, low, open and close price. With this simple set of data you can tell a lot about what’s going on with a chart and anticipate future price moves.
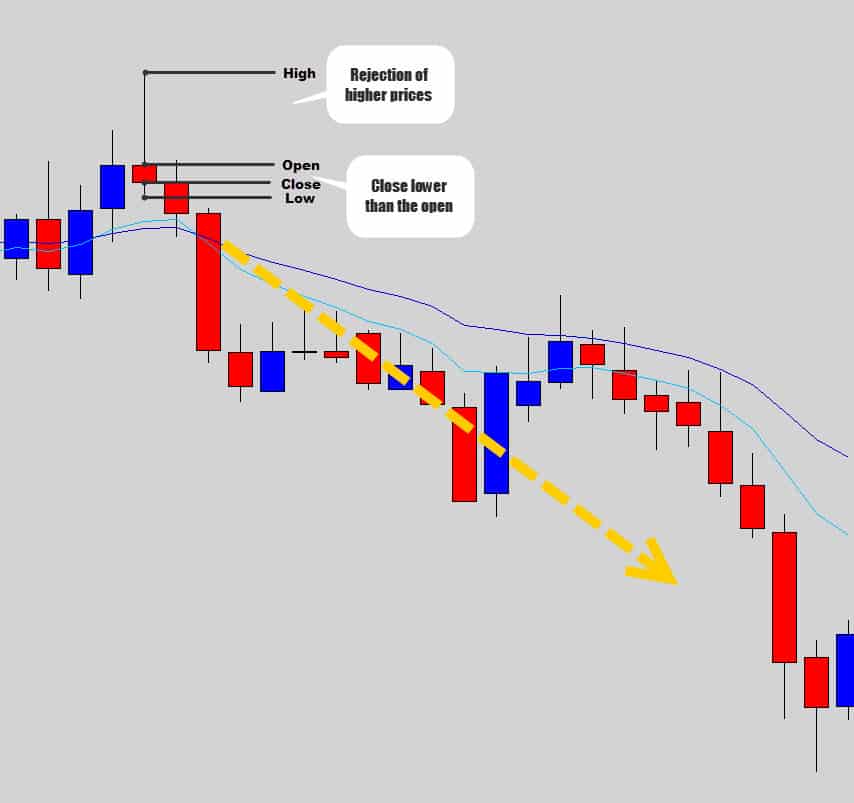
Using the 4 data points of a candle above, we can identify simple ‘buy’ and ‘sell’ signals. The chart above illustrates a candlestick sell signal called the Rejection Candle Reversal pattern.
A rejection candle is the most common occurring candlestick reversal signal in the markets. In the example above, the candle shows the trader that the market rejected higher prices during that trading session – closing way off it’s highs.
The closing price for the day was also lower than the opening price, which is another bearish clue. Adding to this further, the rejection candle high price also created a new swing high in the market – this tells us the market is stepping downward with the overall bearish pressure, another bearish clue.
Using these 4 points of data we identified a common candlestick sell signal, and performed some simple market analysis which gave trades that ‘early warning’ hint that the market was about to sell off.
There are many other candlestick signals like this one which are derived from the 4 data points of the common candlestick.
The point is, you don’t need all the extras loaded onto your chart to be able to do great market-analysis or confident trading decisions. Keep things simple, start by stripping back your chart and eliminating the non-essentials to enjoy better clarity and sanity with your Forex trading.
SUMMARY
Newbie traders are notorious for diving head first into a load of indicators. Indicators unfortunately only work under very specific circumstances, and traders will often stack them to try filter out the bad signals one indicator may generate. Often indicators will ‘fight each other’ on your chart and offer conflicting variables. Keep trading simple by learning how to interpret a plain candlestick chart – it’s easier than it sounds.LEARN A STRATEGY THAT WILL KEEP YOUR TRADING SIMPLE

If you’re following a complicated strategy that involves heavy math, a lot of indicators or long hours in front of the screen – you’re going to have a difficult time finding ‘peace’ with your trading.
You need to be clear with yourself about what you want your strategy to do for you. Do you want your strategy to confuse the hell out of you, or provide you a clear and concise way of reading the markets and the means of making a trading decision without all the stress.
You as the trader must enjoy using the strategy you dedicate yourself to, so you stick with it. Choose a lean trading system with less ‘moving parts’, so that you can maintain the K.I.S.S principle with ease (keep it simple stupid).
The one trading methodology I’ve found peace with is price action trading. It’s the most simplistic, and purest method of trading the markets. As I’ve demonstrated in the article already, you can do some really awesome market analysis and anticipate some really profitable price moves by reading the candlesticks – which is the core principle of price action trading.
The best part is that it’s easy to do!
I know that most traders don’t find their ‘place’ in the market until they learn how to read the charts with the price action trading methodology. I hear this first hand every day! I have many testimonials from War Room traders saying they have only started seeing profitability now and wish they found out about price action strategies years ago – you can check them out for yourself.
 Section Widget
 Categories Widget (Show All)